Introduction
TernaryPlot.com is a web application for creating ternary plots (also known as triangular plots, three-component plot, composition triangle, or simplex plots). These plots are useful for visualizing compositions of three components that sum to a constant, commonly used in materials science, soil science, physical chemistry, petrology, and other fields.
The application provides an intuitive interface to help you quickly create publication-quality ternary plots You can add points, lines, areas, and text annotations, customize the appearance, and export your plots.
Free users are limited to 3 plot downloads per week. Purchase a pass for unlimited downloads and additional features.
- Unlimited plot downloads
- SVG export for publication-quality graphics
- Watermark-free plots
- Priority support
There are four different types of element you can add to the plot:
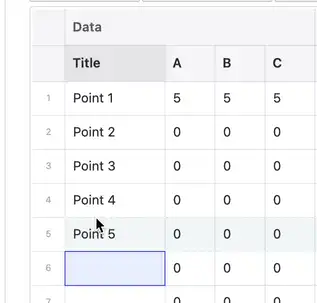
Each type of element has its own table where data can be added.
You can switch between the tables by clicking the table title in the tabs above the table.
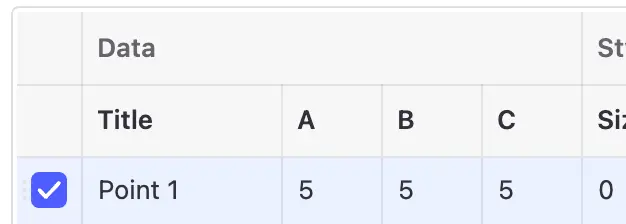
You can select a row using the checkbox that appears when moving the pointer over the number on the left of the table. When a row is selected, you can press backspace to clear it.
You can select multiple rows using Shift and Ctrl/Cmd. When backspace is pressed with multiple rows selected, all selected rows will be cleared.
When you select one or more rows, a bulk-edit bar appears above the table. It lets you change a style property for every selected row at once, instead of having to edit each cell individually.
The bar shows controls for the current table's style properties — Fill, Stroke, Symbol, Size, Opacity, and Dash for points, and the equivalent properties for lines, areas, and text. Pick a value and it is applied to all selected rows immediately, as a single step you can undo with Ctrl/Cmd+Z.
This is the quickest way to recolor a group of elements, swap symbols for a set of points, or resize many points at once. To style elements automatically based on the values in your data instead, use the Scales feature.
Elements are plotted in the following order (back to front)
- Areas
- Lines
- Points
- Text
Elements are plotted in the order they appear in the table. If you want some element to appear on top of another element of the same type, move that element below the other element in the table.
For points and text, this means you can drag that row down. For points and areas, you will have to move all multiple rows down.
See the Overplotting question in the FAQ in case your element is not discernable anymore.
There are two ways to change the labels of the data.
- Press the in the toolbar above the table (on the right side).
- Or press a label in the plot to edit that label. Enter your text and confirm by pressing the Enter key or click the confirm button next to the input field.
Be aware that when formatting a CSV file for upload, you have to name the data columns in your CSV files a,
b, and c.
Already naming the columns in the CSV file will not work, they really have to be a,b,c.
Press the download button in the toolbar above the plot.
You can change the format by clicking the chevron on the right side of the button. Note that SVG download is a premium feature.
SVG export is a premium feature.
SVG is the ideal choice if you plan to make any edits to your plot after downloading. As a vector format, SVG allows you to:
- Edit any text or labels
- Move and resize individual elements with precision
- Change colors, styles and other properties
- Add new elements or annotations
- Scale the plot to any size without losing quality
You can edit SVG files using popular vector graphics software like Inkscape (free), Adobe Illustrator, or Figma (free for personal use).
Unlike pixel-based formats like PNG, SVG files maintain clarity at any scale - from tiny thumbnails to large posters. This makes SVG the most flexible format for your ternary plots.
PNG is a widely supported image format that produces high-quality plots suitable for most purposes. However, since PNG is a raster format (made up of individual pixels), it cannot be easily edited after export. The plot dimensions and resolution are fixed - scaling it larger will result in pixelation.
PNG is ideal when you:
- Need a final version for publication or presentation
- Want to share the plot in a universally compatible format
- Don't anticipate needing to make further edits
- Require a smaller file size than SVG
If you think you might need to modify the plot later (adjust colors, move elements, edit text, etc.), SVG would be the better choice.