Uploading and Storing Data
Data in TernaryPlot.com is automatically saved as you work. There are two ways your data is stored:
By default, all your plot data is automatically saved in your browser's local storage. This means:
- Your data persists between browser sessions
- Your work is saved even if you close the browser
- Your work is saved even if an error occurs
- The data remains private to your browser
If you have an active subscription, you can optionally enable cloud sync to sync your data to your TernaryPlot.com account:
- Data syncs automatically across all your devices
- Changes sync in real-time
- You can access your plots from any browser
To toggle between cloud sync and local-only storage, use the data sync toggle button in the toolbar at the top of the data tables. The button shows "Cloud sync" when enabled or "Local only" when disabled.
Once enabled, sync happens automatically in the background. There's no need to manually save or sync your work. Note that this functionality stops when your premium pass ends!
Press the button above the table to download the data of that table in CSV format.
CSV files can be uploaded and read into each table separately. Each table (Points, Lines, Areas, Text) has its own Upload button. Upload a CSV by pressing the button above the specific table you want to populate and select your CSV file.
CSV files must be formatted correctly.
- They must contain the right column names. The correct column names per table type are listed below. Note that you have to name the data columns in your CSV files
a,b, andc. Column order does not matter - only the names must match. - The entered values must be valid, for example, a symbol of a point can be only one of the 14 symbol types and a color must be a valid color.
- Use a period (dot) as a decimal separator. Not a comma.
- Points
title,a,b,c,value,size,symbol,fill,stroke,opacity,strokeDasharray
- Lines
title,a,b,c,curve,stroke,strokeWidth,strokeDasharray,opacity
- Areas
title,a,b,c,curve,fill,fillOpacity,stroke,strokeOpacity,strokeDasharray
- Text
text,a,b,c,fontSize,dx,dy,fontStyle,fill,textAnchor,rotation,opacity
Get started by downloading one of these sample CSV files with demo datasets for points and then upload them to the points table.
TernaryPlot.com supports exporting your plot data to Excel (.xlsx) format and importing it back. This makes it easy to work with your data in Microsoft Excel, Google Sheets, or other spreadsheet software.
Download a template Excel file with the correct structure and column headers:
Download Excel Template
The template includes all required sheets (Points, Lines, Areas, Text, Metadata) with proper column headers and one example row showing the expected format.
To export your plot to Excel:
- Click the Export button in the data toolbar (above the tables)
- Select Excel (.xlsx) from the menu
- Save the file to your computer
The exported Excel file contains:
- Separate sheets for each data table: Points, Lines, Areas, and Text
- A Metadata sheet with plot settings like axis labels, template, and legend position
- All your data with proper column headers
Note: Callouts and legend items are not included in Excel exports since they're primarily interactive UI elements. They are preserved when using JSON export formats instead.
Note: Excel import is a premium feature. Free users can import data using CSV files one table at a time.
To import an Excel file:
- Click the Import button in the data toolbar
- Select Excel (.xlsx)
- Choose your Excel file
The import will:
- Load all data from the Points, Lines, Areas, and Text sheets
- Apply metadata settings (axis labels, template, legend position)
- Validate all data and show errors for any invalid values
- Filter out empty rows (where a=0, b=0, c=0)
- Apply proper padding to tables for easy editing
Important: Your Excel file must conform to the expected format for import to succeed:
- Sheet names must match exactly:
Points,Lines,Areas,Text,Metadata(case-sensitive) - Column headers must match the required names (see CSV formatting section below for exact column names)
- Column order does not matter - only the column names must match
- Data values must be valid:
- Numbers for
a,b,ccoordinates (must sum to 100 or close to it) - Colors must be valid hex codes (e.g.,
#FF0000) or CSS color names - Symbols must be one of the 14 valid symbol types (see Points documentation)
- Use periods (
.) as decimal separators, not commas
- Numbers for
- Empty cells in optional columns (like
value,fill,stroke) will be filled with default values
If validation fails, you'll see specific error messages for each invalid value. The import will skip invalid rows but import all valid data.
You can edit the exported Excel file and import it back to TernaryPlot.com:
- Export your plot to Excel (free for all users)
- Edit the data in Excel or Google Sheets
- Keep the sheet names unchanged (Points, Lines, Areas, Text, Metadata)
- Keep the column headers in the first row
- Import the modified file back (requires premium subscription)
Tip: The Excel format is great for:
- Sharing your plot data with colleagues who prefer spreadsheets
- Batch editing large datasets
- Preserving both data and plot configuration together
- Creating backups of your work
For a complete export including callouts, inset, and legend items, use the Full plot (.json) export option instead.
You can paste values directly into multiple data cells at once from Excel or Google Sheets. You can also copy plain text as long as the values are separated by tabs.
- First, select and copy multiple cells in Excel/Google sheets.
In a table on TernaryPlot.com, select the first cell you want to copy in to. Make sure the cell is only selected and not being edited. Press the Escape key to exit edit mode.
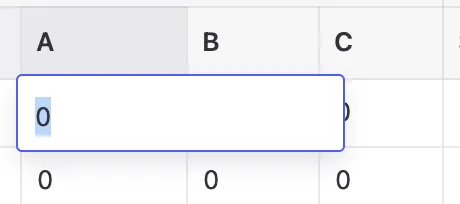
A table cell in edit mode 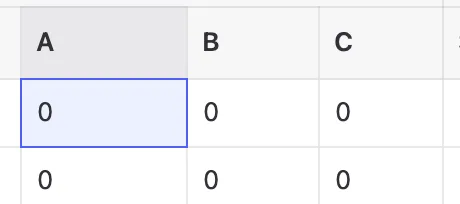
A table cell that is selected Paste when the cell is selected and not in edit mode. Multiple cells will be set at once now.
Note that the cell values are validated on paste. A warning will be displayed for each invalid value.
You can review the warnings by pressing the above the table.
;